- Inici
- Departament
- Nous estudiants
- Docència
- Grau
- Postgraus, Màsters i Doctorat
- Mobilitat i intercanvi
- Pla d’acció tutorial (PAT), Filologia Catalana
- Pla d'acció tutorial (PAT), Lingüística General
- Sortides professionals (Filologia Catalana)
- Sortides professionals (Lingüística General)
- Estudiants amb necessitats específiques
- Aula de Literatura i Meditació
- Horaris de visita
- Recerca
- Publicacions
- Actualitat
Data Visualisation for Supporting Linguists in the Analysis of Toxic Messages
Any
2021
Lloc
WSCG 2021 Proceedings, Computer Science Research Notes (CSRN) 3101
ISBN
ISSN 2464-4617
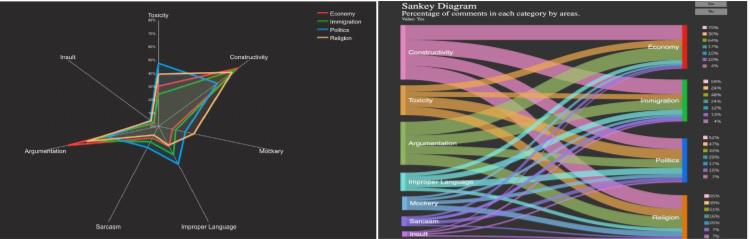
The goal of this research is to provide linguists with visualisations for analysing the results of their hate speech annotation. These visualisations consist of a set of interactive graphs for analysing the global distribution of annotated messages, finding relationships between features, and detecting inconsistencies in the annotation. We used a corpus that includes 1,262 comments posted in response to different Spanish online new articles. The comments were annotated with features such as sarcasm, mockery, insult, improper language, constructivity and argumentation, as well as with level of toxicity (’not-toxic’, ’mildly toxic’, ’toxic’ or ’very toxic’). We evaluated the selected visualisations with users to assess the graphs’ comprehensibility, interpretability and attractiveness. One of the lessons learned from the study is the usefulness of mixed visualisations that include simple graphs (Bar, Heat map) - to facilitate the familiarisation with the results of the annotated corpus together with more complex ones (Sankey, Spider or Chord) - to explore and identify relationships between features and to find inconsistencies.
dilluns, 6 setembre, 2021 - 12:14